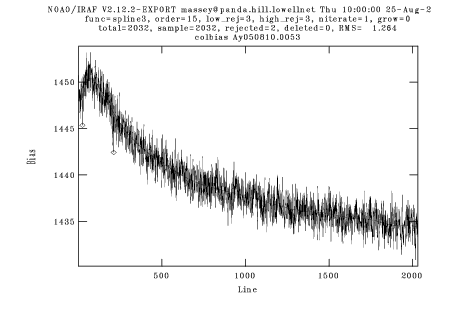
The Ohio State Y4KCam page discusses the herring-bone pattern that comes and goes on the detector, but there are additional problems in the bias structure. Let me illustrate this by simply looking at the behavior of 10 consecutive zero second (bias) exposures.
For this, I've labeled the four quadrants:
# IMAGE       MEAN     MIDPT      MODE    STDDEV  OVERSCAN  DIF
 A53.fits     1451.     1451.     1451.     9.3   1438.    13
 A54.fits     1451.     1451.     1450.     9.6   1438.    13
 A55.fits     1471.     1471.     1470.     9.1   1457.    14
 A56.fits     1460.     1461.     1458.     9.1   1447.    13
 A57.fits     1454.     1455.     1455.     9.4   1441.    13
 A59.fits     1469.     1469.     1469.     9.2   1455.    14
 A60.fits     1451.     1451.     1450.     9.3   1438.    13
 A61.fits     1452.     1452.     1452.     9.9   1439.    13
 A62.fits     1452.     1452.     1451.     9.3   1439.    13
 A63.fits     1451.     1451.     1450.     9.6   1438.    13
Unforunately, the bias structure itself changed considerably during this time: and the shape of the overscan (say) had no correlation with the high or low values. We illustrate this as follows:
A53, 1451ADU/1438ADU

A54, 1451ADU/1438ADU
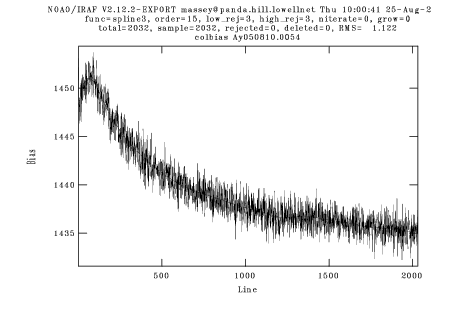
A55, 1471ADU/1457ADU
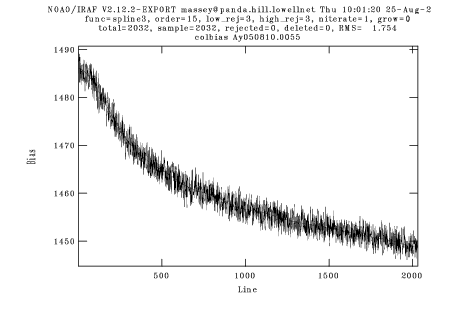
A56, 1460ADU/1446ADU
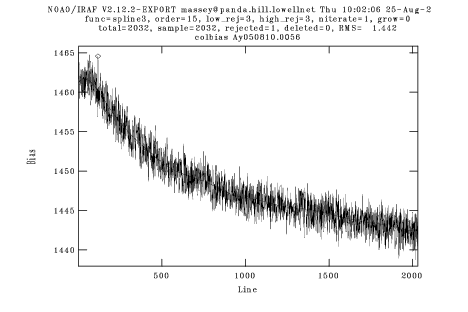
A57, 1454ADU/1441ADU
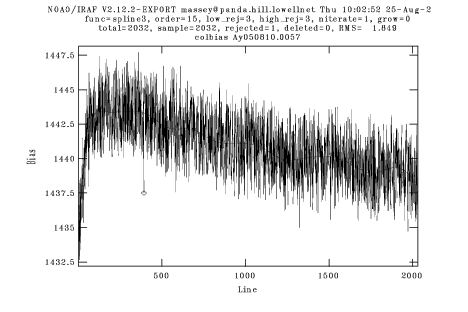
A59, 1469ADU/1455ADU
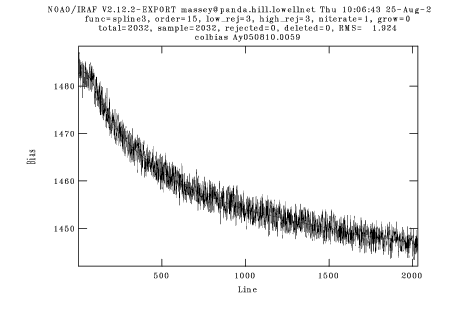
A60, 1451ADU/1438ADU
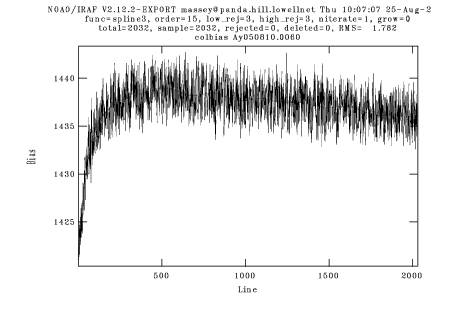
A61, 1452ADU/1439ADU
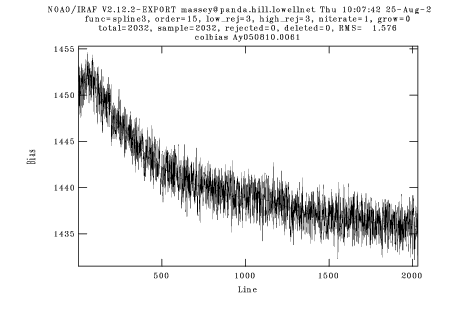
A62, 1452ADU/1439ADU
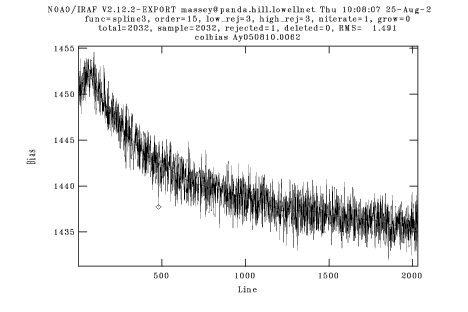
A63, 1451ADU/1438ADU
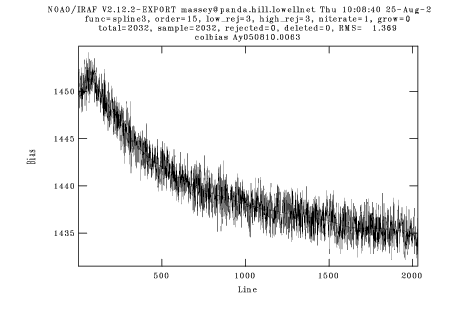
In other words, the bias is changing randomly in the "y" direction, as revealed by the overscan. "A60" is a good example: a perfectly "normal" average value, but the low "y" values are about 30ADU lower than the low "y" values on (say), A61, which has the same average value.
With the bias structure changing like this, there is no way to properly remove the 2-D structure in the images. Fortunately for stellar photometry this doesn't much matter over most of the frame. The structure in the bias is low compared to the average count level in the flats (30 ADU vs 30,000 ADU, or 0.1%), and so the flat-fielding should work fine. Determination of local sky will remove this bias variation everywhere, EXCEPT at the places where the quadrants join. There the jump in ADU level will prevent reasonable photometry (i.e., for a 5-pixel aperture, a 4-ADU variation would correspond to 5% error for a star with 10,000e).
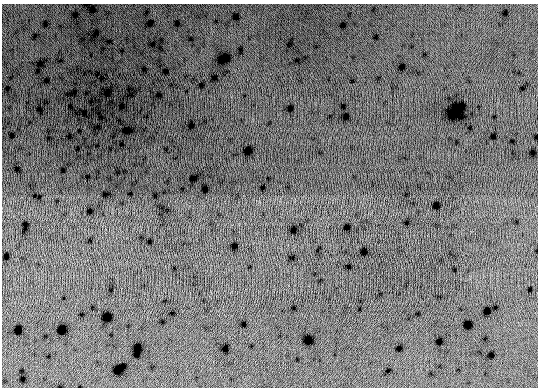
Column plot through the above:
