A Survey of the Resolved Stellar Content of Nearby Galaxies Currently Forming Stars

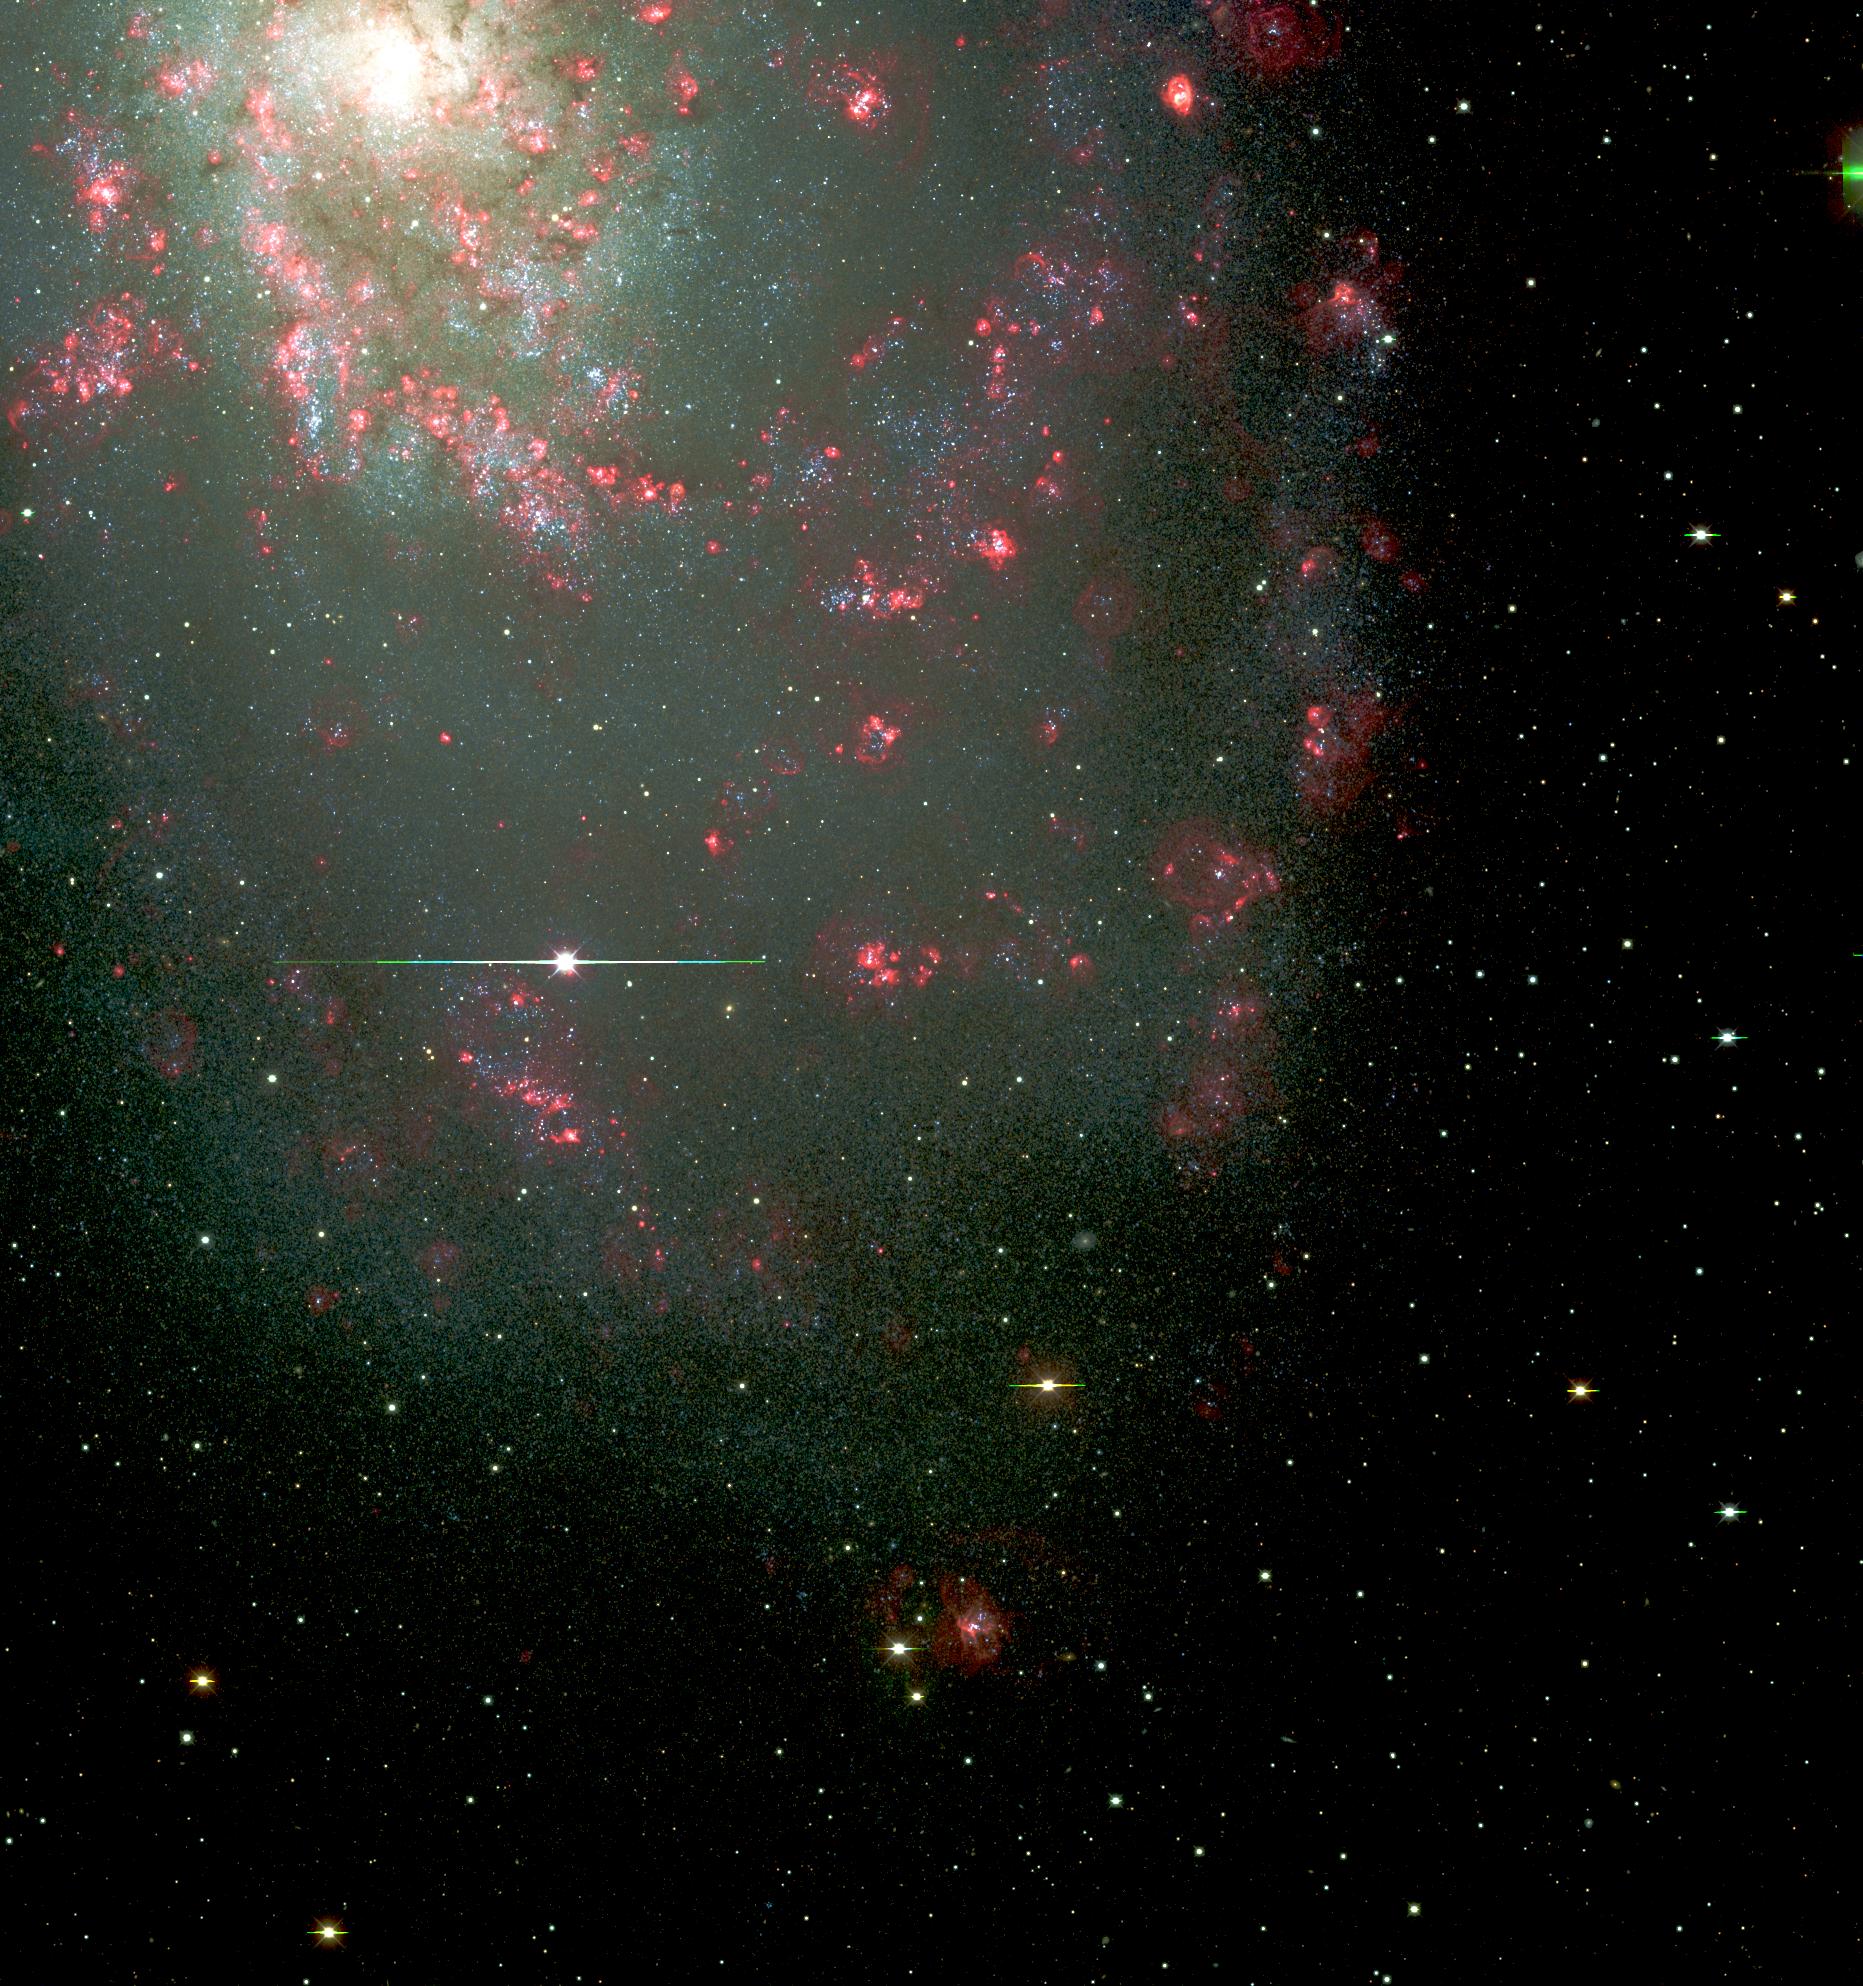
Two of our 10 M31 fields mosaiced together; color based upon our BVR images.


The galaxies of the Local Group serve as our laboratories for understanding star formation and stellar evolution in differing environments: the galaxies currently active in star-formation in the Local Group cover a factor of 10 in metallicity and span a range of Hubble types from dwarf spheroidal to Irr to Sb and Sc. We are conducting a uniform survey (UBVRI, Halpha, [SII], and [OIII]) of nearby galaxies selected on the basis of current star formation. In the Local Group, this sample includes M31, M33, NGC 6822, IC 1613, IC 10, WLM, Pegasus, and Phoenix; we exclude the Milky Way and Magellanic Clouds, which are being surveyed separately by seve ral groups. We also include Sextans A and Sextans B, located just beyond the Local Group (van den Bergh 1999a, 1999b). Using the new, wide-field Mosaic cameras, we are producing catalogs of UBVRI photometry of roughly a million stars, using Halpha, [SII], and [OIII] to distinguish bona fide stellar members from compact HII regions. This on-line catalog will answer a number of scientific questions directly, but we believe that the real strength of this survey will be in the science we will enable with 8-10-m class telescopes and the capability of follow-u p spectroscopy. In addition, the calibrated images will provide a detailed, uniform atlas of both the stellar and ionized gas components of these galaxies, which will certainly prove useful for a host of other projects.


The Team

The following compose our Survey Team:


NEW COLOR IMAGES (February 2007)

CTIO has kindly put nice versions of our images as downloads; go to http://www.ctio.noao.edu/images/download_pict/local_group_survey.htm

In addition.... Mosaic of our 10 M31 frames! If that takes too long for you to download, try this smaller version. Put together by K. Olsen.

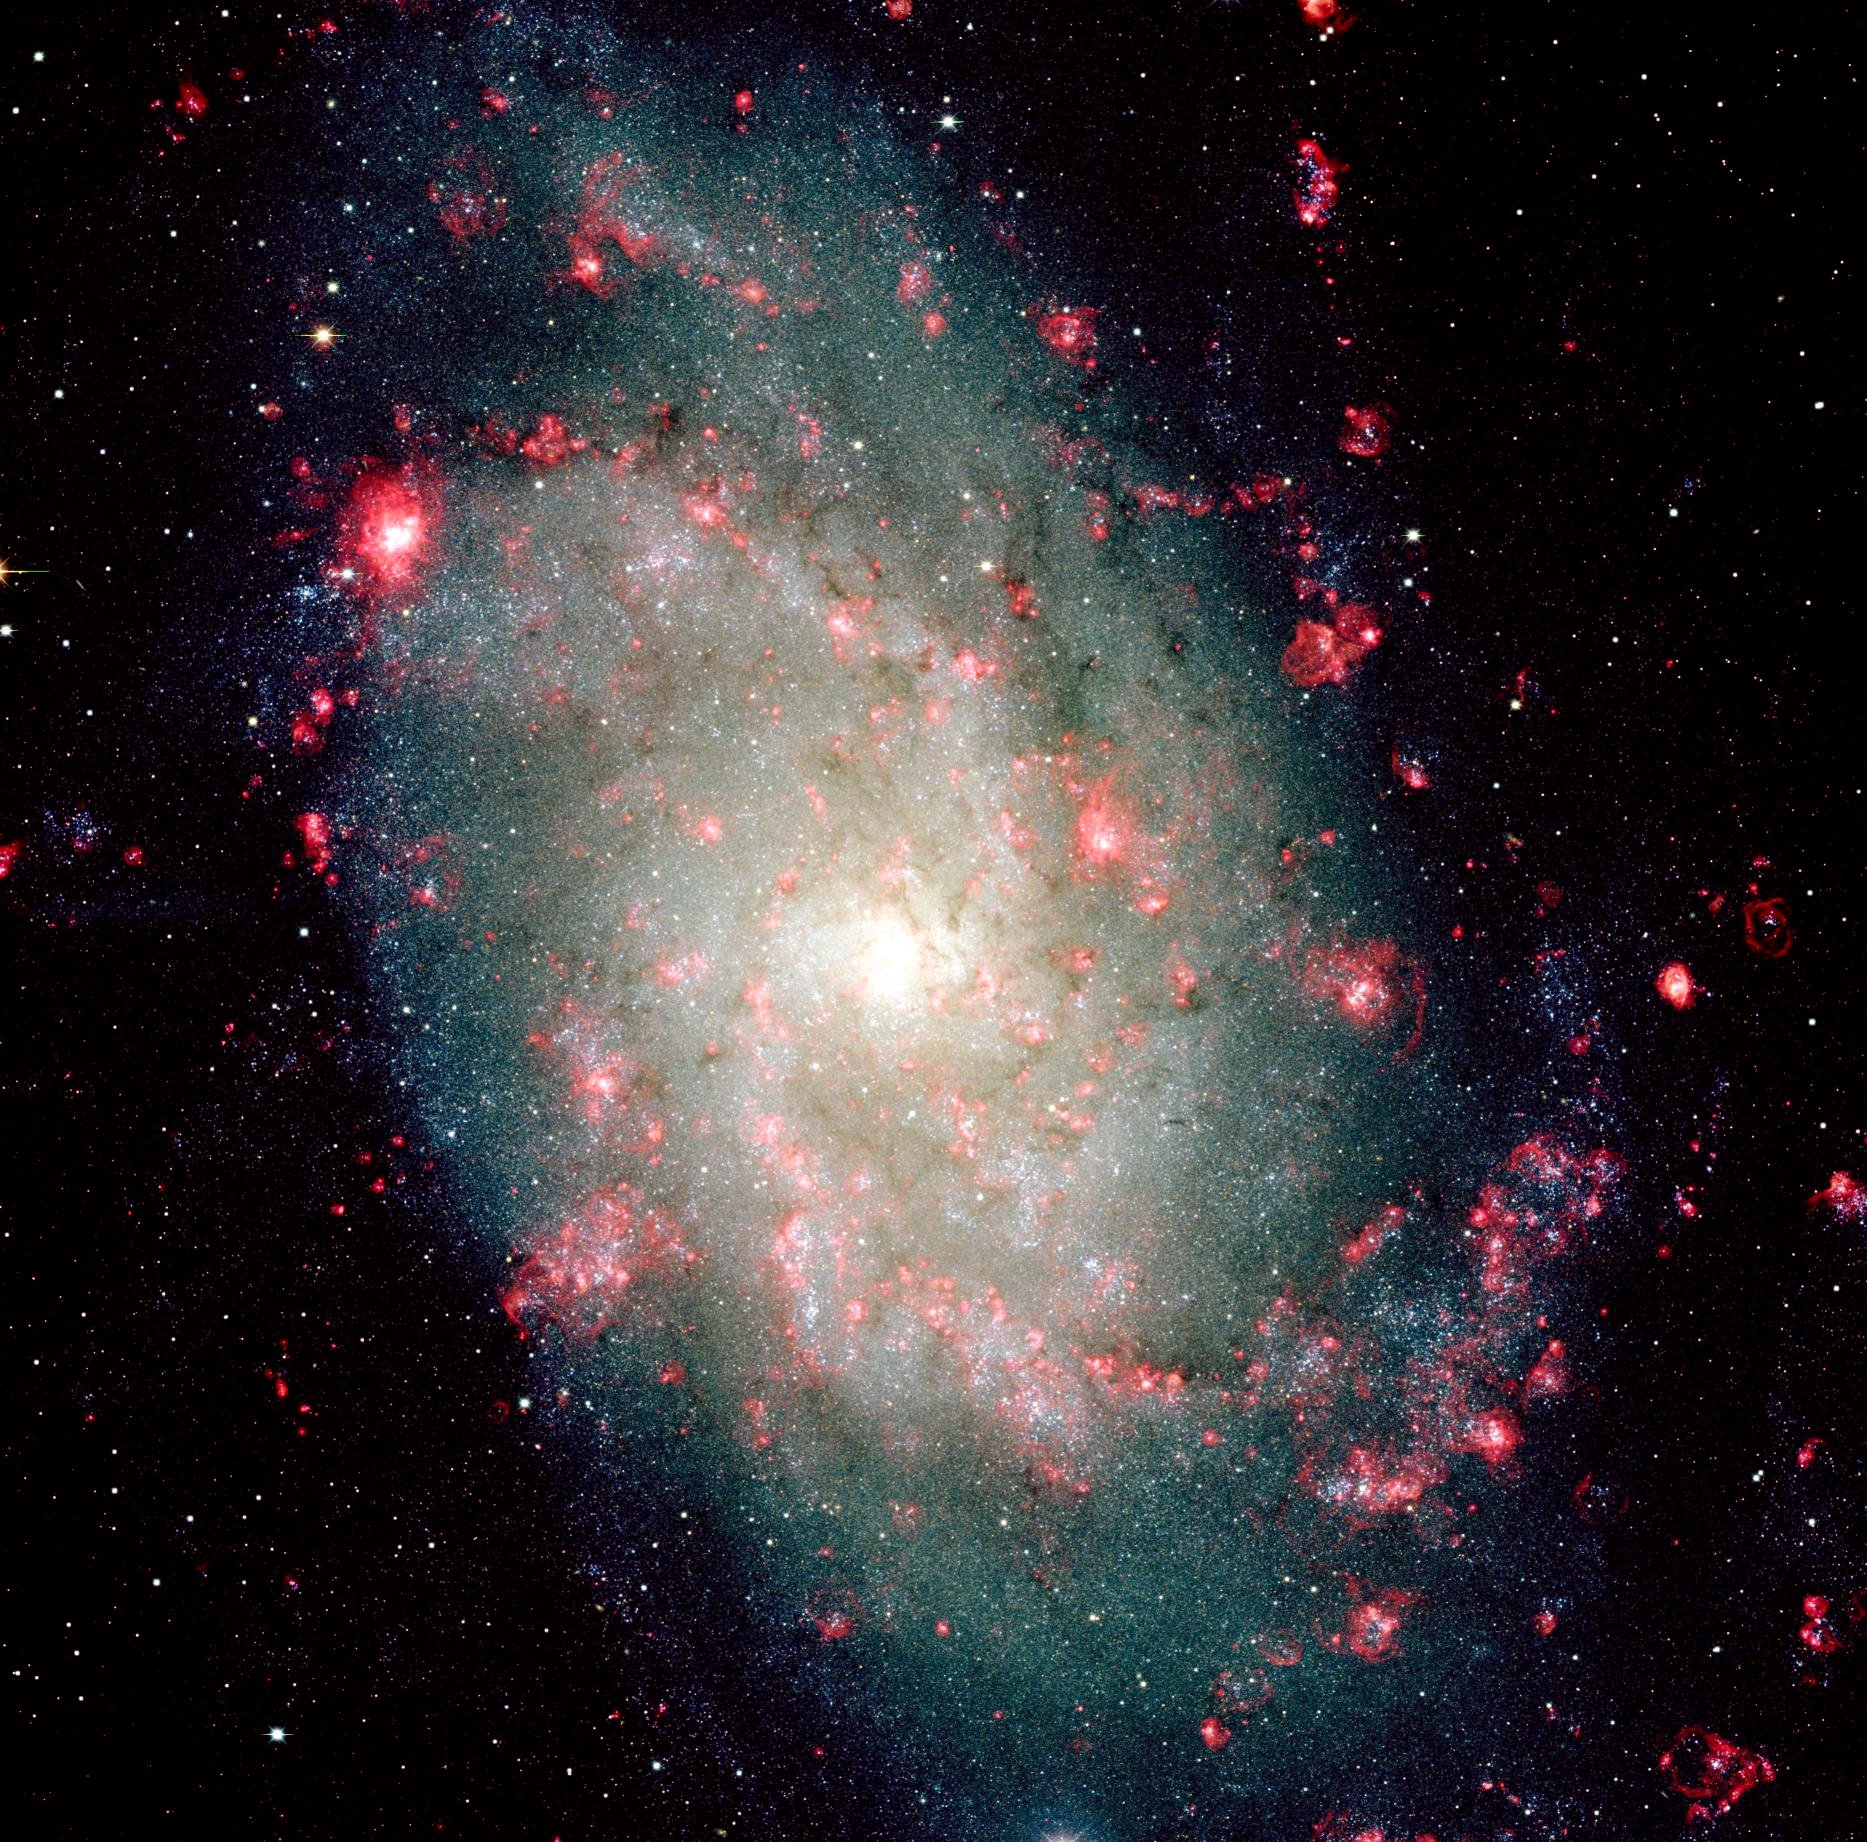
Mosaic of our 3 M33 frames put together by K. Olsen.

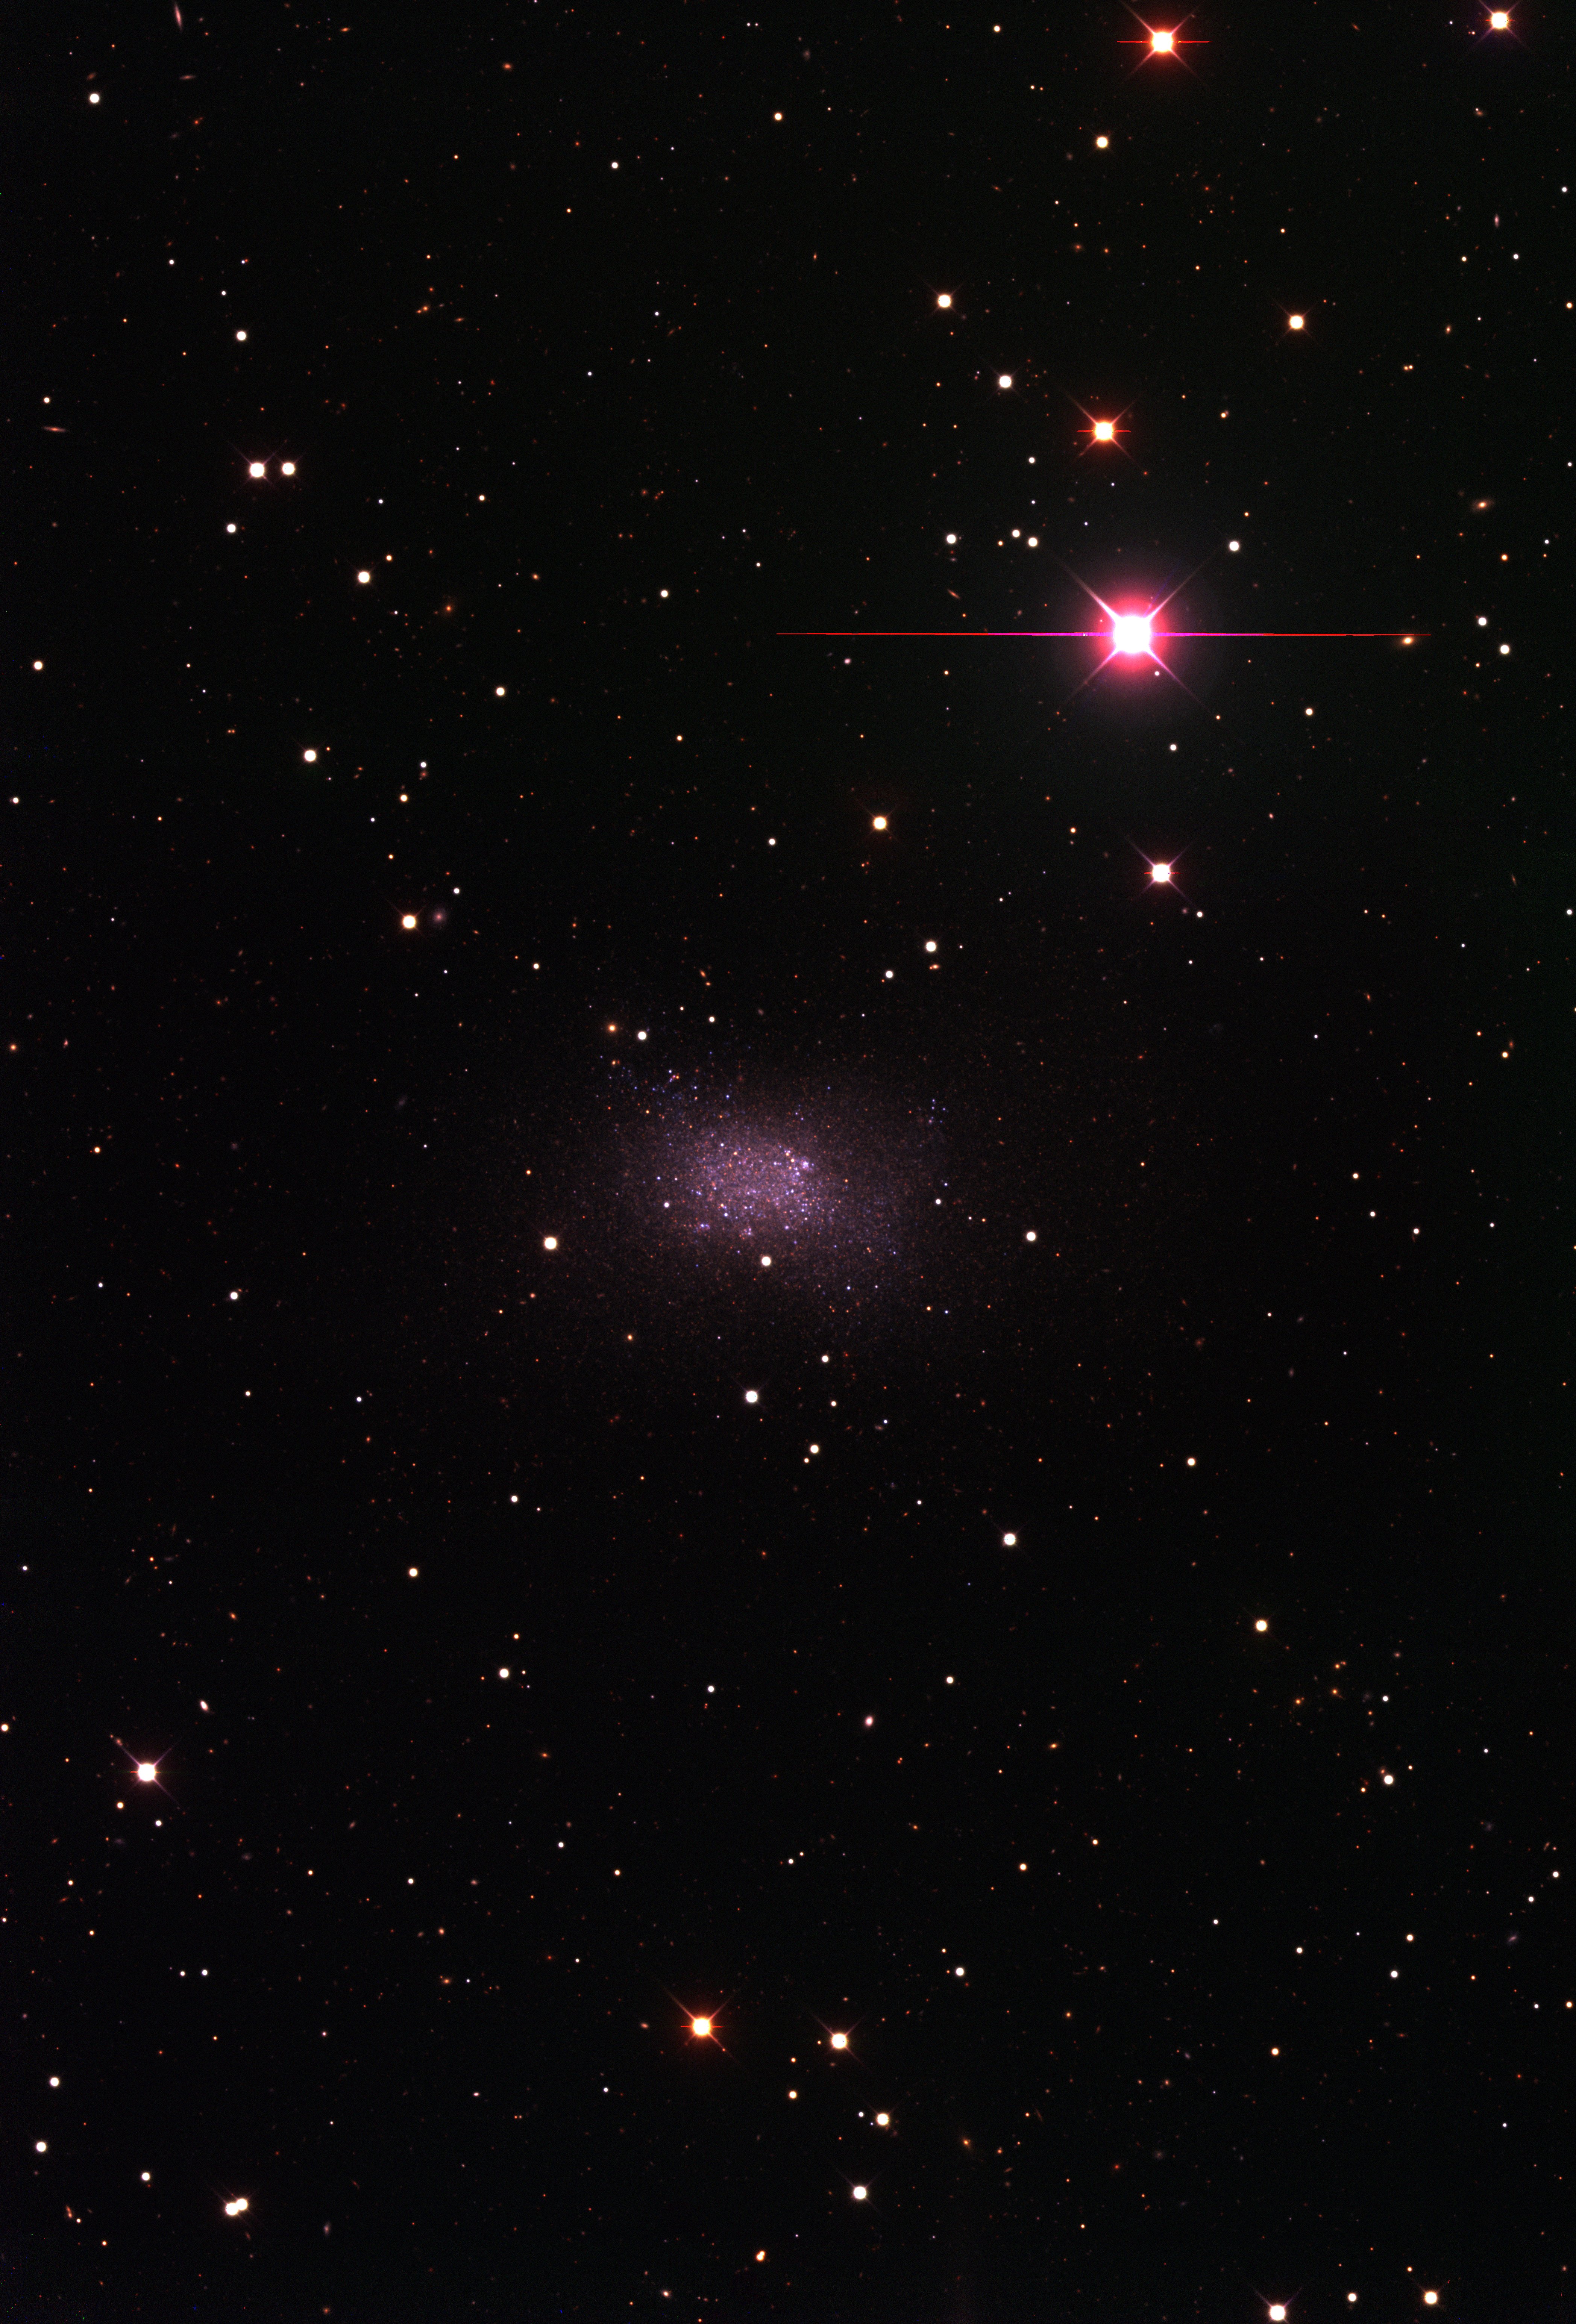
High resolution IC10 put together by K. Olsen

High resolution WLM put together by K. Olsen

High resolution Phoenix put together by K. Olsen

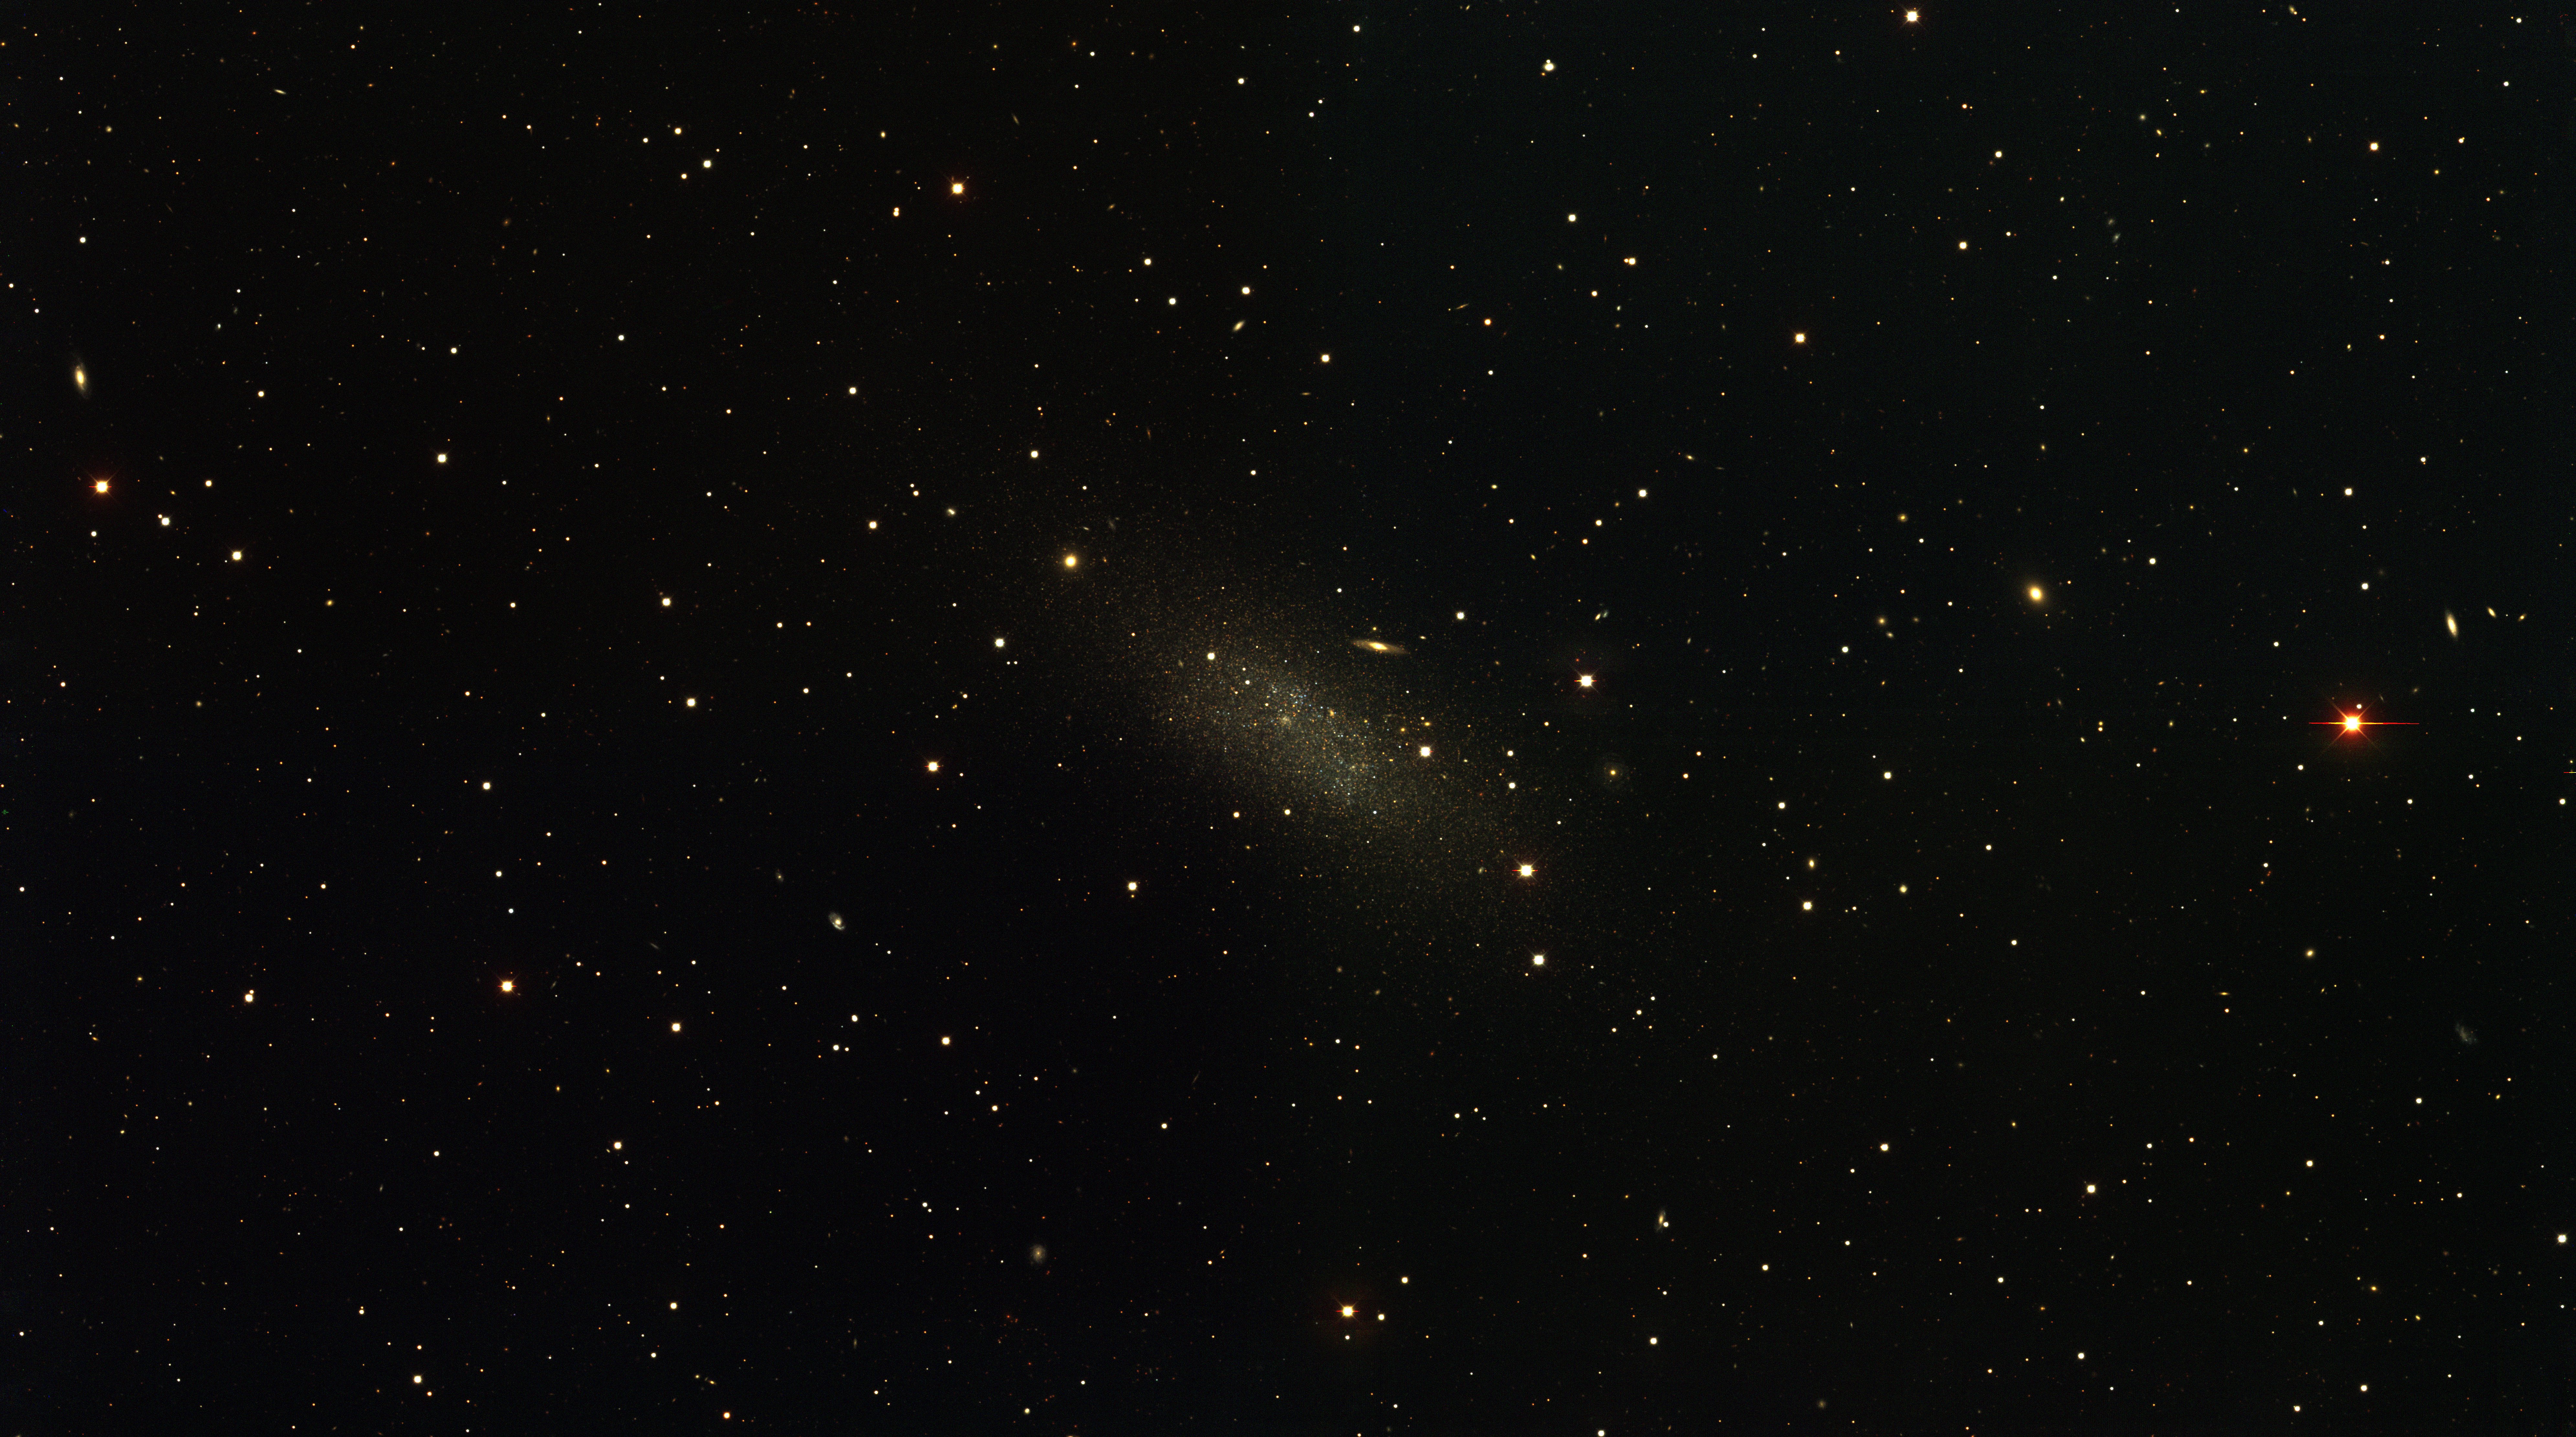
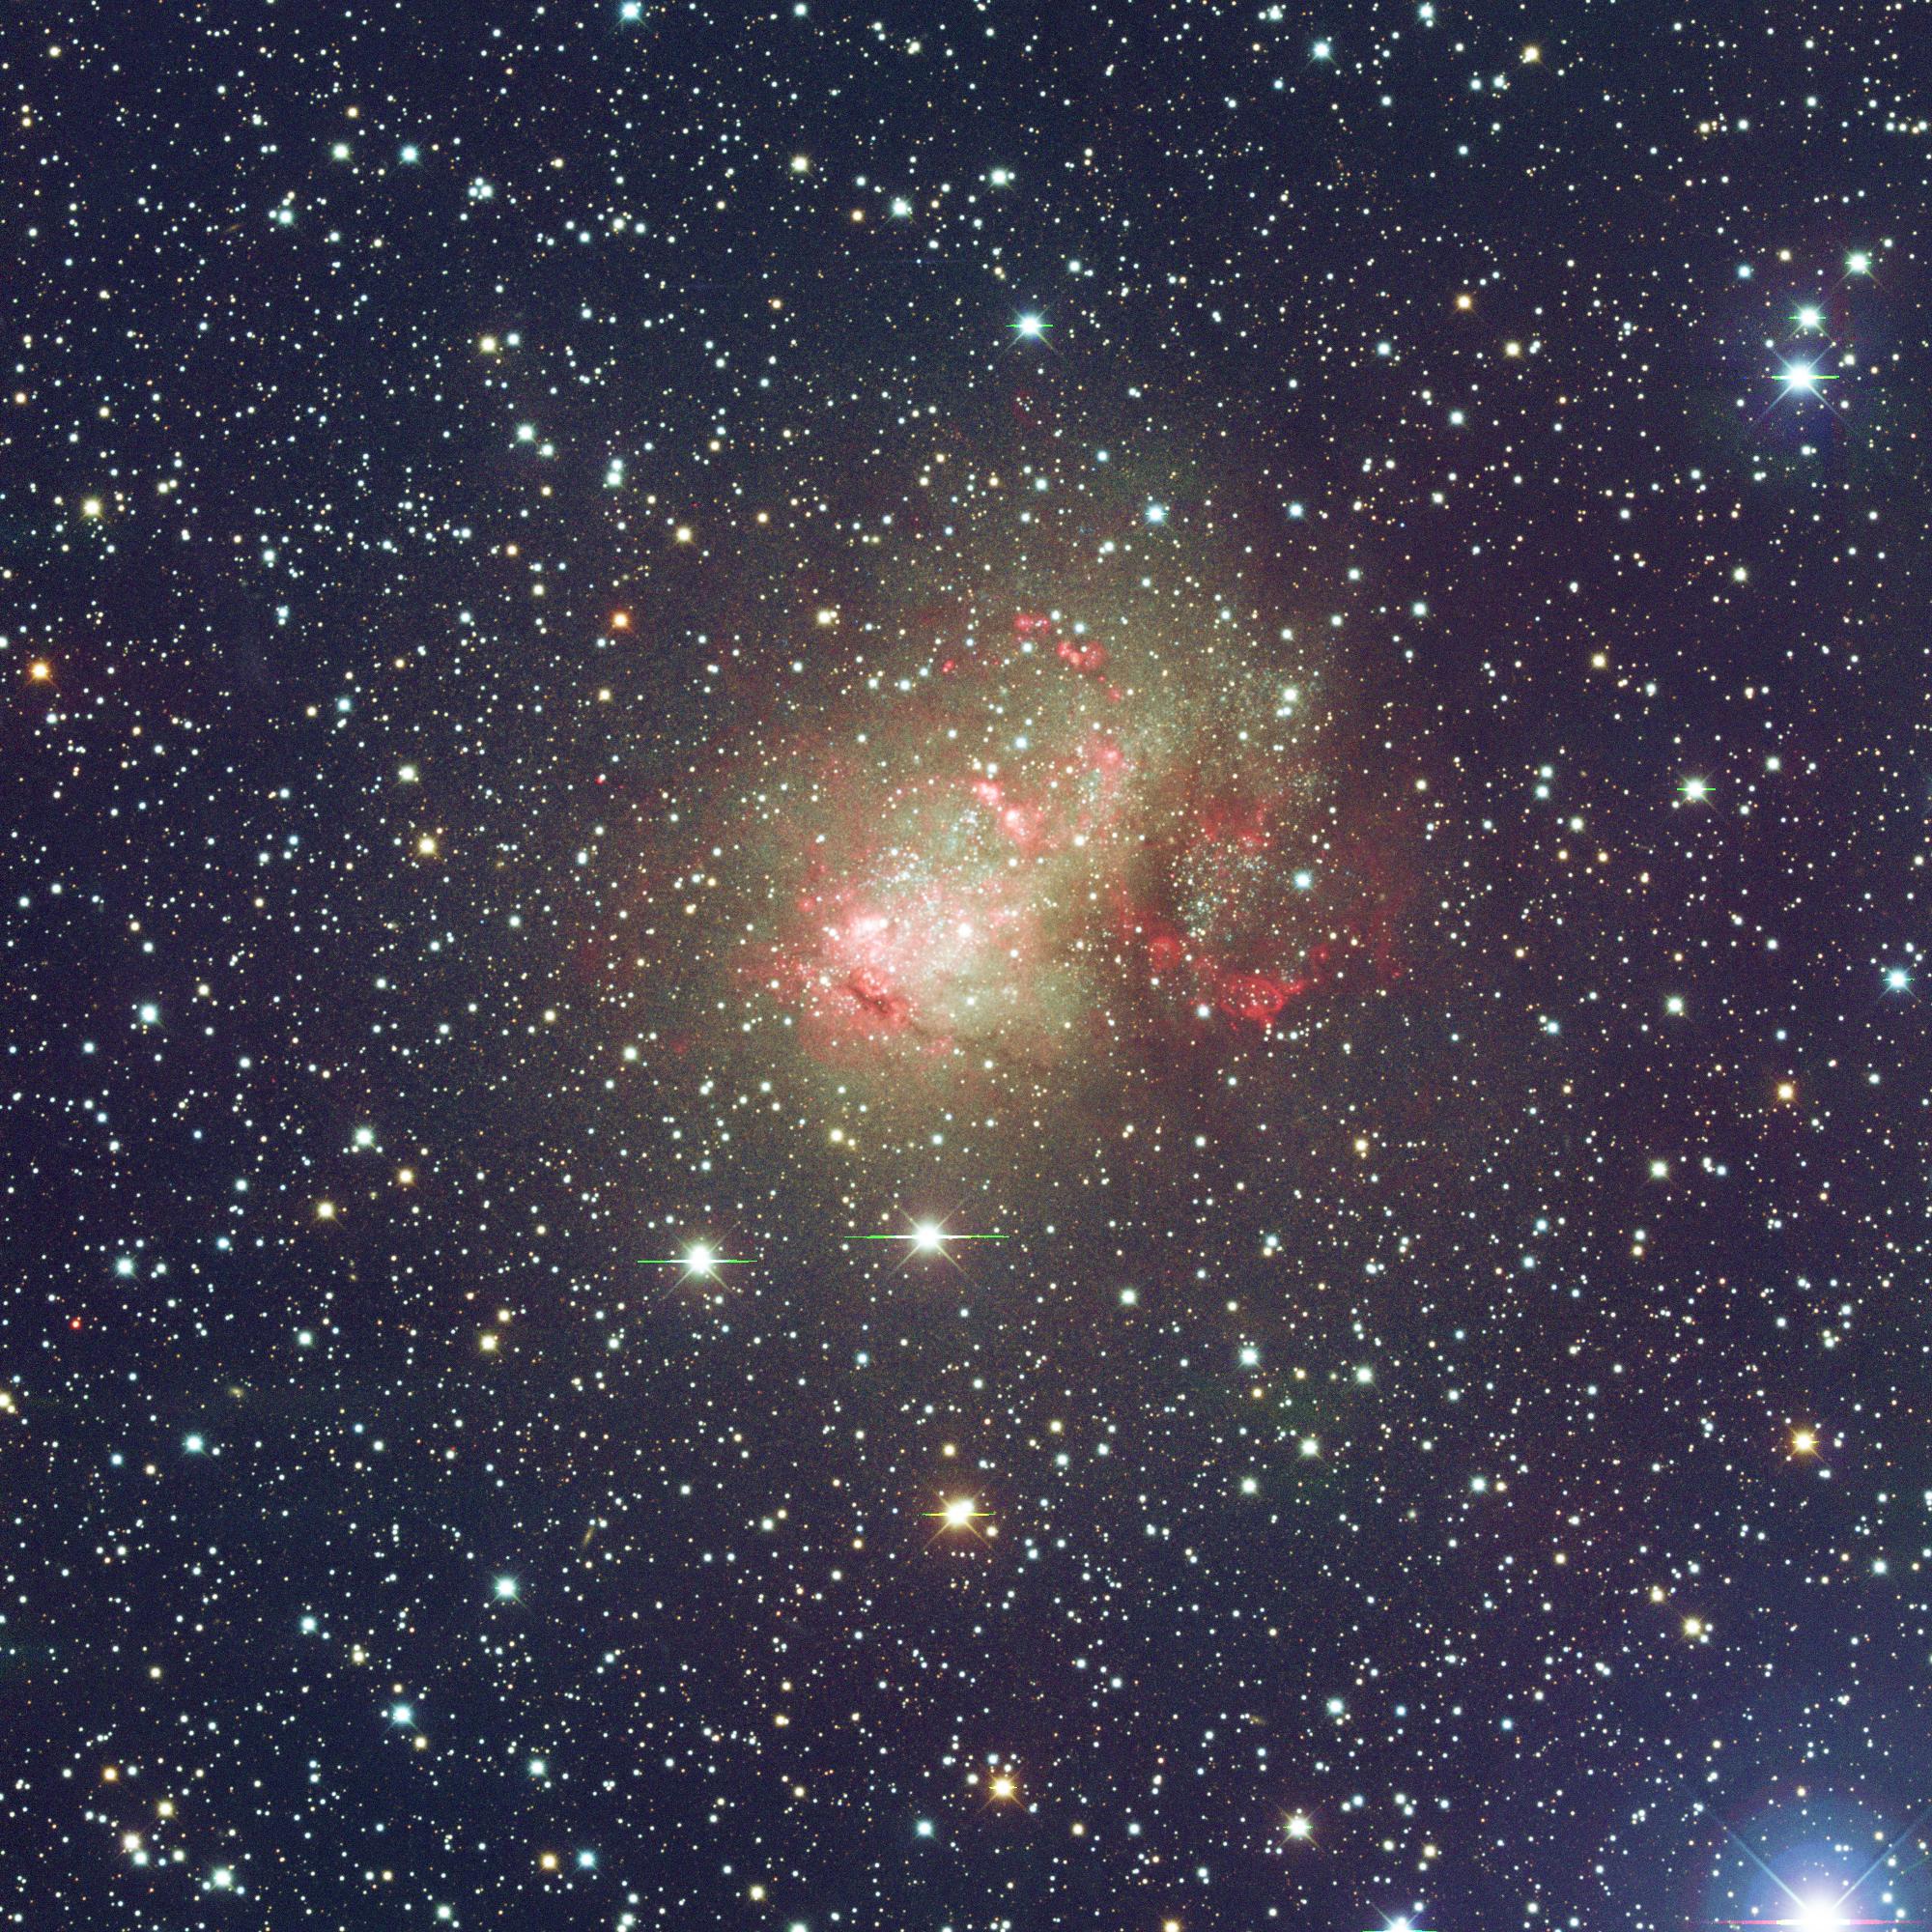
High resolution NGC6822 put together by K. Olsen

High resolution Sextans A put together by K. Olsen

High resolution Sextans B put together by K. Olsen

High resolution the Pegasus dwarf put together by K. Olsen Large version of M31 Fields 1 and 2 mosaic

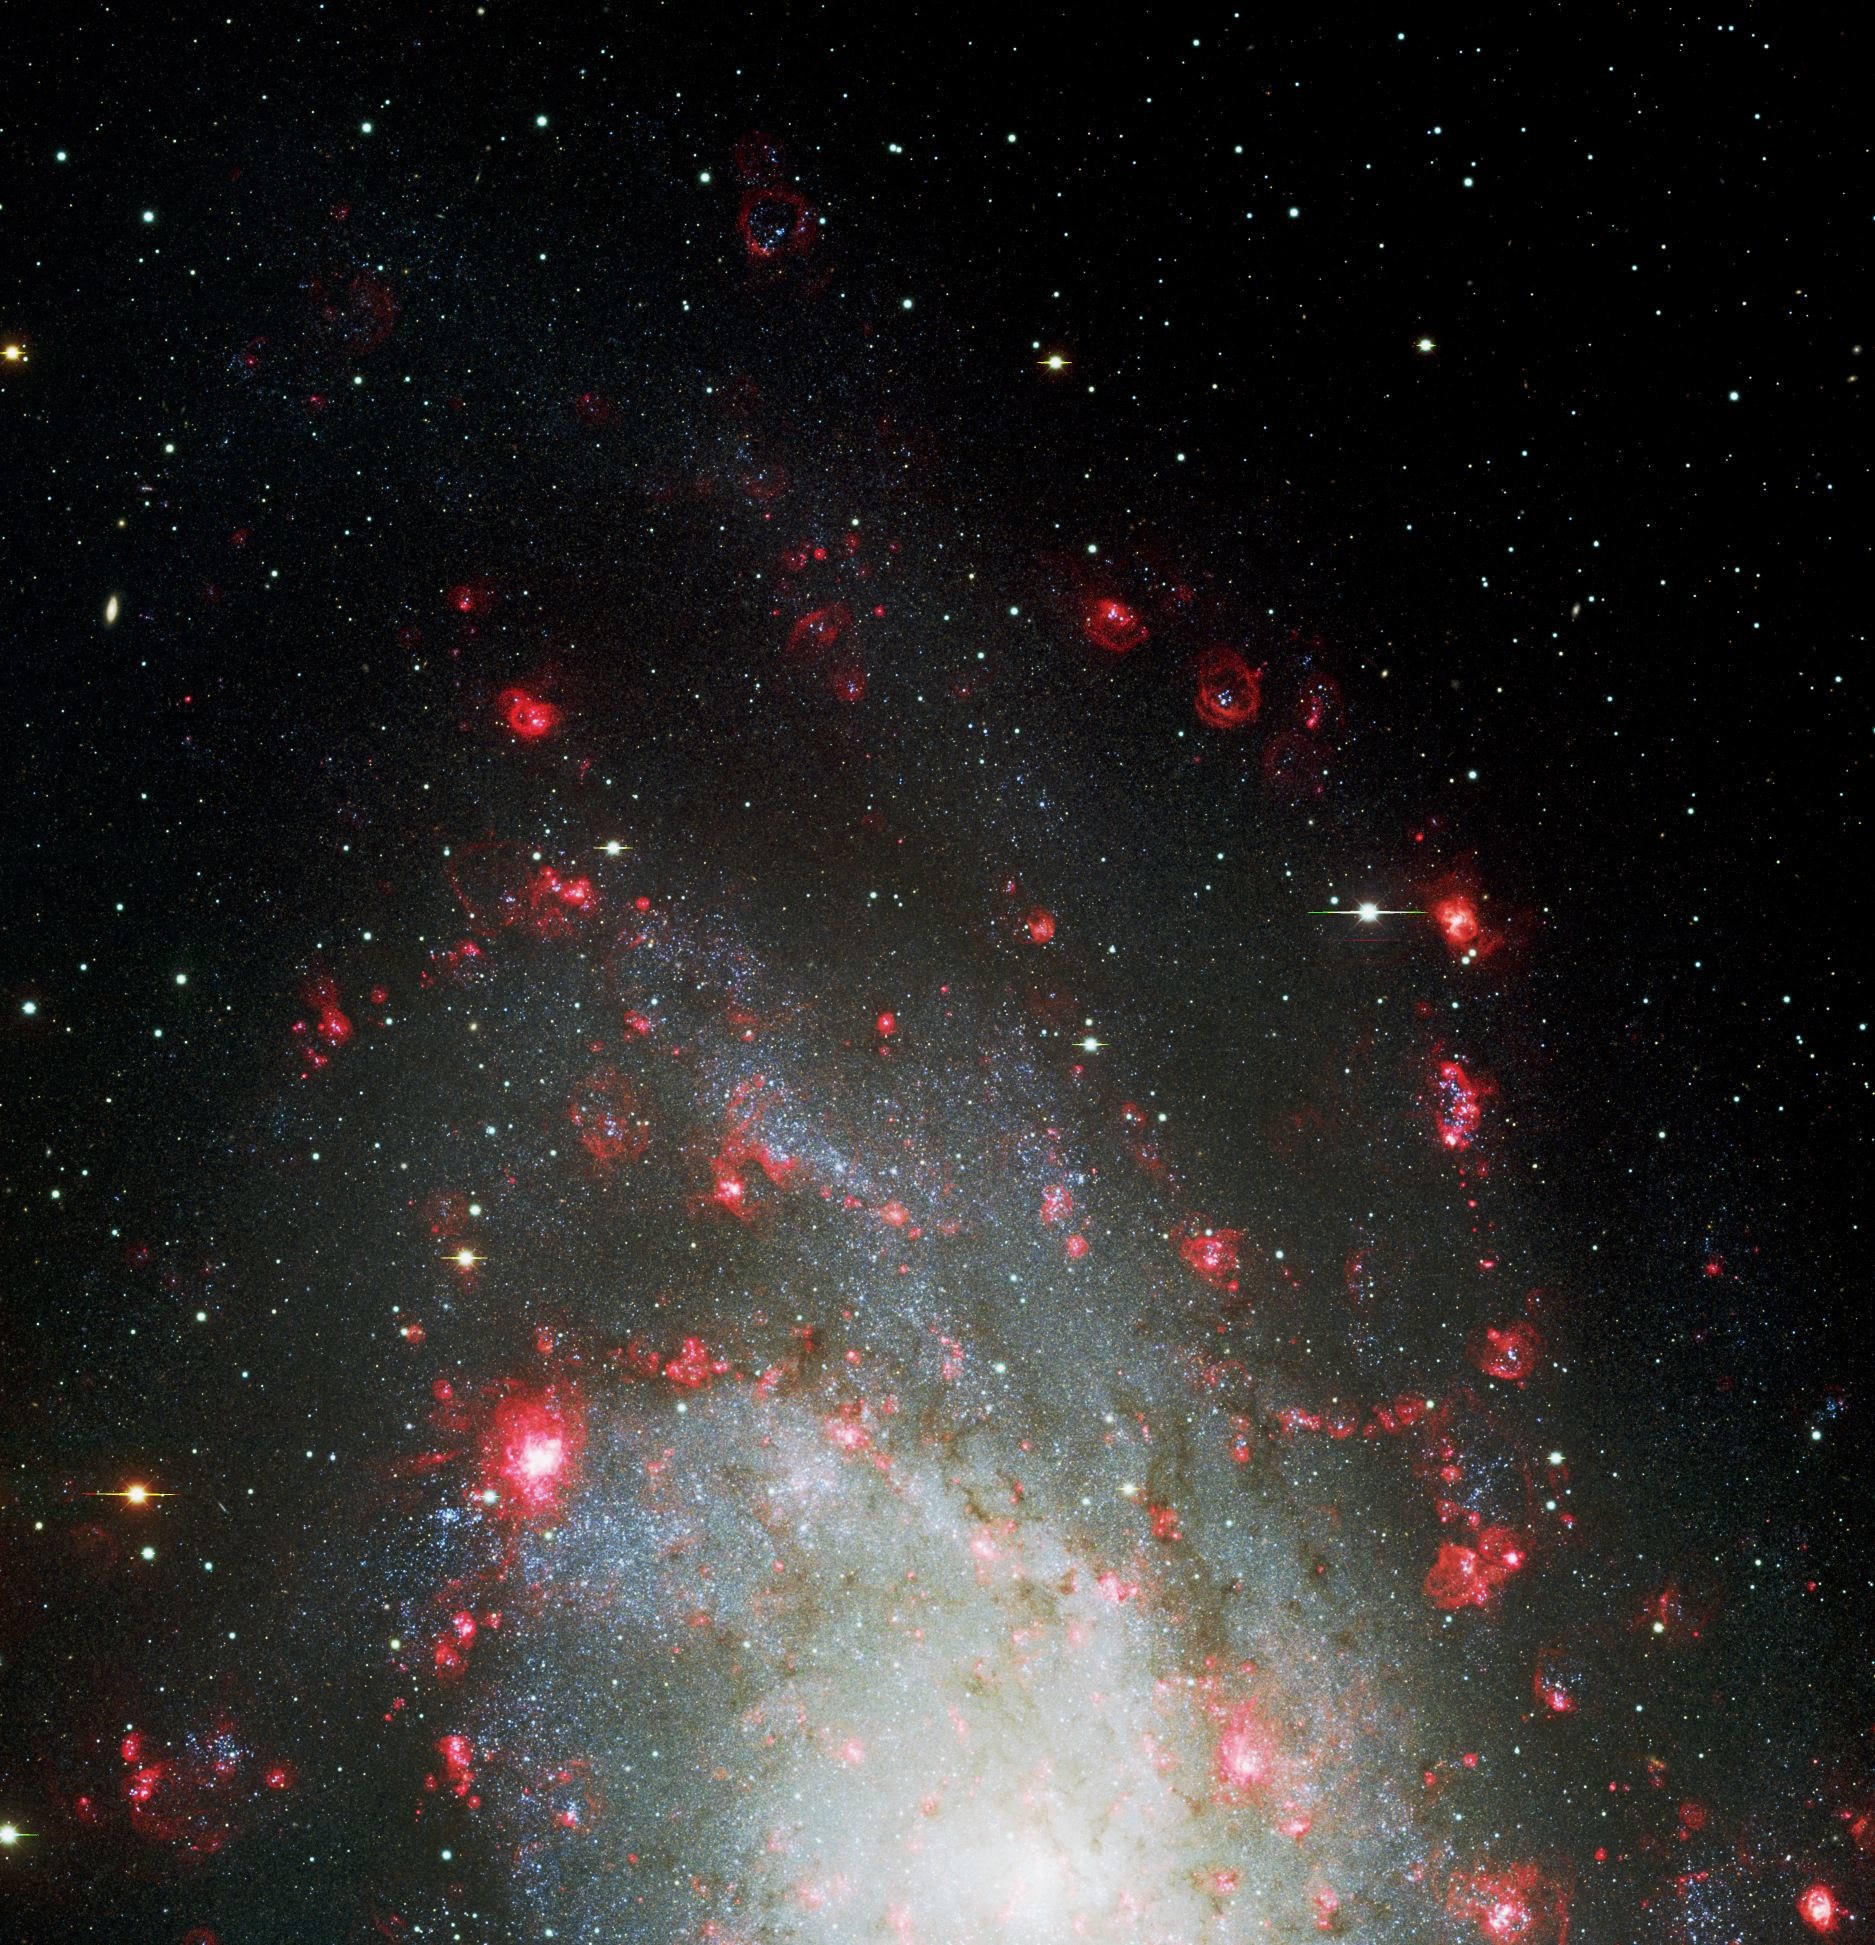
High resolution M33 (3 fields) (HII regions emphasized)

High resolution M33 North (HII regions emphasized)

High resolution M33 Center (HII regions emphasized)

High resolution M33 South (HII regions emphasized)

High resolution IC10


DATA RELEASE

We have now released all of our images: 20 fields (M31: 10 fields, M33: 3 fields, plus IC10, N6822, WLM, Phoenix, Pegasus, Sextans A, and Sextans B.) The stacked images can be downloaded either from ftp://ftp.lowell.edu/pub/massey/lgsurvey or from http://www.archive.noao.edu/nsa/ The individual images can be obtained from http://www.archive.noao.edu/nsa/ Tell them Phil send you.

Our UBVRI and narrow-band photometry is complete. The first paper ``A Survey of Local Group Galaxies Currently Forming Stars. I. UBVRI Photometry of Stars in M31 and M33 was published in Massey et al. 2006 AJ 131, 2478.

The second paper, ``...II. UBVRI Photometry of Stars in Seven Dwarfs and a Comparison of the Entire Sample" has now also come out: Massey et al. 2007, AJ, 133, 2393.

The third paper, "...III. A Search for Luminous Blue Variables and Other Halpha Emission-Lined Stars" is now also out: Massey et al. 2007, AJ, 134, 2474

The UBVRI data files can be downloaded here:

PLEASE send me (phil.massey at lowell.edu) a note giving publication information if you use our data or photometry so we can include it when we are bugged by NOAO to give them this information each year.

What about the emission-line data (not covered in the above? We discuss the calibration and give the final numbers in Massey et al (2007, AJ, 134, 2474); see Table 2. Note that there is a typo in the table, though: the units for the emission-line filters should be ergs/sec/cm^2, not ergs/sec/cm^2/A.


PUBLICATIONS (Ours and Others)

We also milked the survey for several AAS posters and talks:

Here is the final status report to the NOAO survey workshop, April 14, 2003.


How We're Reducing Our Mosaic Data


Our color-terms: We've measured the broad-band color terms for both Mosaic-N (Massey et al. 2006 AJ, 131, 2478) and Mosaic-S ( Massey et al 2007 AJ, 133, in press>).


A few points about photometry


The Galaxies

Click on the link for our finding charts, made from the DSS, and showing the region to be covered by our survey.


Some of Our Science Goals


Red Supergiants:
BVR photometry will allow us to distinguish bona-fide red supergiant stars (RSGs) from red foreground dwarfs, a problem even at high galactic latitudes (see Massey 1998, ApJ, 501, 153 ). This will allow accurate number ratios of blue to red stars (B/R) to be determined as a function of position within these galaxies for comparison with the prediction of stellar evolutionary models. These data will also yield the relative number of RSGs to Wolf-Rayet (WR) stars in these galaxies, an important diagnostic of massive star evolutionary models. (The WR content is known from other surveys, with a new, global study of M31 being conducted concurrently.) Because stellar winds are driven by radiation pressure via highly ionized metals, mass-loss rates depend upon metallicity; such mass-loss is believed to have a controlling effect on the evolution of the most luminous stars, but empirical checks on such stellar evolution tracks are sorely lacking (cf. Maeder \& Conti 1994, ARAA, 32, 227).

LBVs and Other Luminous Stars with Halpha Emission:
Stars with Halpha emission will be readily identified, and the [SII] and [OIII] filters will allow us to distinguish these from compact H~II regions. Such Halpha bright objects will include candidate Luminous Blue Variables (LBVs), originally known as Hubble-Sandage Variables ( Hubble \& Sandage 1953, ApJ, 118, 353), and the related high-luminosity B[e] stars. LBVs have luminosities that are at or exceed the Eddington limit, and recent surveys have shown that the detection of such stars by their variability alone may miss a substantial fraction (Massey et al. 1996, ApJ, 469, 629), in accord with the belief that LBVs may be a normal stage in the evolution of the most massive stars. (See Humphreys \& Davidson 1994, PASP, 106, 704 for a review.) However, other recent work suggests that some LBVs are quite isolated from other massive stars (King et al. 2000, AJ, submitted), lending credence to the suggestions that the LBVs are primarily a binary star phenomenon (e.g., Gallagher \& Kenyon 1985, ApJ, 290, 542). Unbiased statistics are needed, and our survey will provide the candidates for follow-up spectroscopic surveys and photometric monitoring programs. These studies are also necessary groundwork in understanding whether LBVs may be used as good distance indicators. These stars are the optically brightest in star-forming spirals and irregulars. Leitherer (1997, in Luminous Blue Variables, ed. A. Nota \& H. Lamers, p. 97) in showed that the luminosities of LBVs follow a reasonably well-defined relation when plotted against parameters derived from optical spectra, similar to the relationship found by Kudritzki et al.\ (19 96) and Kudritzki (1997) for O-A supergiants. In addition to LBVs, we expect to find other interesting H$\alpha$-emission objects. The unique object SS433 (Margon 1984, ARAA 22, 507) in our own Milky Way indicates that unexpected and rare objects may be found, but only if we look!

Star Formation and the Initial Mass Function:
Good UBV photometry is a critical necessity for identifying the most massive stars, but is insufficient by itself to determine the initial mass function via a luminosity function; for this, spectroscopy is needed. A survey such as ours will identify the stars for which spectroscopy with GMOS on Gemini will allow the direct determination of the initial mass function in these nearby systems, for comparison with the Milky Way and Magellanic Clouds.

Star Formation Histories:
Color-magnitude and Hess diagrams obtained from these data will be used to estimate the star formation histories in these galaxies. This is most efficaciously done by comparing to theoretically simulated Hess diagrams using quantitative techniques such as the ones used by Tolstoy and Saha (1996, ApJ, 462, 672) and Dolphin (1997, New Astronomy, 2, 379). While some studies can be done with HST data (e.g. Gallagher et al. 1998, AJ, 115, 1869; Tolstoy et al. 1998, AJ, 116, 1244; Hodge et al.\ 1999b, ApJ, 521, 577), the galaxy-wide effects and interconnections that show how star formation proceeded in the distinct morphological or kinematically defined components of the galaxy can only be studied using a survey such as the one we are proposing here. This topic is of utmost importance in reconciling star formation histories inferred from high redshift galaxy counts with that from the fossil record of stars in galaxies in the local universe.

The Halos of Galaxies:
How extended are the halos around galaxies? This question has not been adequately answered, even for our own galaxy, where a census of halo stars (in situ) is severely thwarted by large numbers of indistinguishable nearby disk ``contaminants''. Most techniques, such as those based upon observations of RR Lyrae stars, are severely hampered by selection effects. This question is best answered by looking to nearby external galaxies. Consider M31. By counting stars delineated by colors and magnitudes corresponding to old red giants (which effectively also rejects contamination from unresolved background galaxies -- though in seeing better than 1 arc-sec one can also reject them on the basis of image morphology) the density of the halo can be traced out to 100 kpc in projection assuming an R**-3.5 law. Is there a tidal cut off closer in?

Gradient of Stellar Populations:
From the V- and I-band images, it will be possible to map the ages and metallicities of the older (T > 1 Gyr) stellar subsystems in the outer regions of these galaxies by comparing color-magnitude diagrams with globular cluster fiducial sequences (Da Costa and Armandroff 1990 AJ, 100, 162). The properties of the older populations can then be compared to those of the younger stars to clarify the star formation and chemical enrichment history of each galaxy.

HII Regions and the Extent of Diffuse HII:
Although our focus is on the resolved stellar content of these galaxies, we would be remiss not to take advantage of what we can learn about the ISM and its interactions with the stellar component of these galaxies. All of these galaxies have measurable amounts of HI gas. Some gas will be ionized from hot stars within the galaxies, some by intergalactic UV, and some by shocks. The proposed deep, large-format Halpha, [SII], and [OIII] images will define the extent of the ionized emission, which may extend well beyond the galaxies in bubbles, filaments, and chimneys ( Howk and Savage 1997 AJ, 114, 2463; Rand 1998 ApJ, 501, 137). Our survey will allow study of both the diffuse HII and the discrete HII regions, which in some cases, such as for M33 (see Hodge et al. 1999a PASP, 111, 685), are only partially identified in the outer parts of the galaxies. The [SII] exposures will be effective in detecting supernova remnants, while the [OIII] exposures are suitable for seeking out the higher excitation gas, such as plantary nebuale and hot HII regions. Images of these galaxies in these three emission line filters can also serve as a good comparison to those being obtained by the Magellanic Cloud Emission-line Survey currently underway at Tololo (Smith 1999, in New Views of the Magellanic Clouds, p. 28). Follow-up spectra would allow modeling of the relative importance of ionization mechanisms in galaxies of different mass, star formation activity level, and metallicity.

This material is based upon work supported by the National Science Foundation under Grant No. 0093060. Any opinions, findings, and conclusions or recommendations expressed in this material are those of the author(s) and do not necessarily reflect the views of that National Science Foundation.

E-mail: massey @ lowell.edu

Last updated Jan 4 , 2008